Image Details
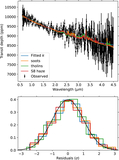
Caption: Figure 3.
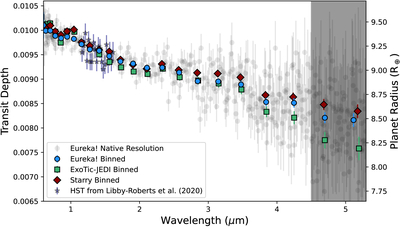
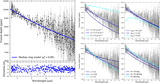
Kepler-51d’s transmission spectrum observed with JWST/NIRSpec-PRISM covering 0.6–5.3 μm. The numerous gray points are the best-fit transit depths from the Eureka! reductions assuming a native resolution. These points were then binned to an R ∼ 10 plotted as blue circles. The same technique was applied to the ExoTic-JEDI fits (green squares). The starry spectrum (red diamonds) was derived by first binning the spectroscopic light curves to this resolution, and then fitting the data. For our analysis, we ignore wavelengths >4.5 μm, as these spectroscopic light curves demonstrated significant noise producing large scatter on the transit depth fits. We’ve also included the HST/WFC3 transmission spectrum (light-blue stars) presented in J. E. Libby-Roberts et al. (2020) for comparison. No offset was applied between the HST and JWST transit depths.
Other Images in This Article
Show More
Copyright and Terms & Conditions
© 2026. The Author(s). Published by the American Astronomical Society.