Image Details
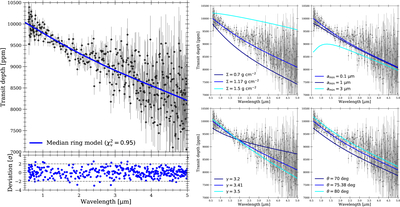
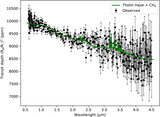
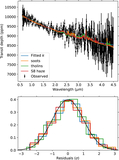
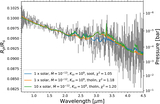
Caption: Figure 10.
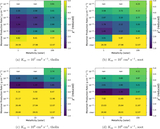
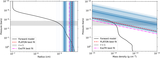
Median ring spectrum (top-left panel) and the model deviation from each data point (bottom-left panel). The right four panels demonstrate how the median spectrum gets affected by the perturbation on ring column mass density Σ, minimum particle size ﹩{a}_{{\rm{\min }}}﹩, power-law index of the size distribution γ, and ring obliquity θ.
Other Images in This Article
Show More
Copyright and Terms & Conditions
© 2026. The Author(s). Published by the American Astronomical Society.
Copyright ©
2026 Astronomy Image Explorer. All Rights Reserved.