Image Details
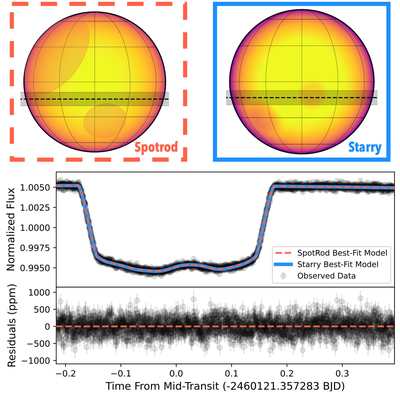
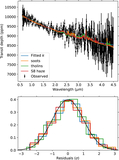
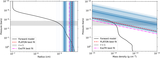
Caption: Figure 1.
Top panel: the best-fit spotrod and starry spot configurations represented on Kepler-51. Middle panel: the JWST white light curve of Kepler-51d with flux binned from 0.6–5.3 μm. Points are binned to 30 s for clarity. Best-fit models from the above spotrod and starry are plotted in orange and blue, respectively. Regardless of the spot configuration, the white light-curve models are identical. Bottom panel: plot showcasing the white light-curve residuals from the spotrod best-fit model above.
Other Images in This Article
Show More
Copyright and Terms & Conditions
© 2026. The Author(s). Published by the American Astronomical Society.
Copyright ©
2026 Astronomy Image Explorer. All Rights Reserved.