Image Details
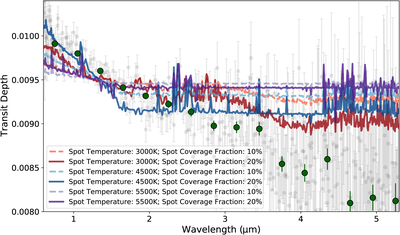
Caption: Figure 13.
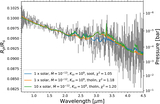
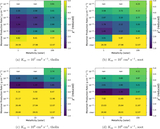
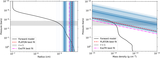
Kepler-51d’s transmission spectrum (gray) and binned spectrum (green) plotted against different simulated transmission spectra assuming only stellar contamination. Each model assumes a photospheric temperature of 5800 K with a varying spot temperature and spot coverage fractions. Spot coverage fractions <5% yielded a nearly flat line or no stellar contamination impact. While cold spots at large coverage fractions could reproduce the bluer <2 μm wavelength slope, no spot temperature and coverage fraction can explain the observed >2 μm slope. Therefore, the transmission spectrum must be due to planetary atmospheric absorption.
Other Images in This Article
Show More
Copyright and Terms & Conditions
© 2026. The Author(s). Published by the American Astronomical Society.