Image Details
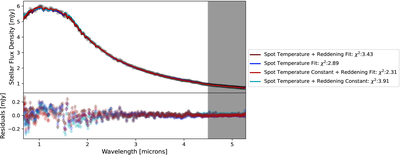
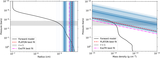
Caption: Figure 12.
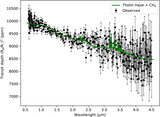
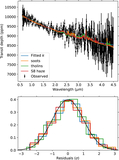
Top panel: plot of the out of transit stellar flux density along with the best-fit models from four different model assumptions. The dark- and light-red lines are from models fitting for the overall reddening, while the dark-blue points are from the model with no reddening but spot temperature fit. The light-blue line shows a model holding spot temperature and reddening constant to the values derived from the spot crossing and dustmaps, respectively. Bottom panel: the residuals color-coded based on their respective models. None of the spectral models are able to reproduce the scatter at wavelengths <3 μm, while all fit the longer wavelengths well.
Other Images in This Article
Show More
Copyright and Terms & Conditions
© 2026. The Author(s). Published by the American Astronomical Society.