Image Details
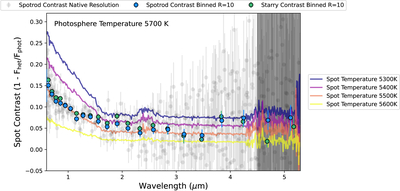
Caption: Figure 11.
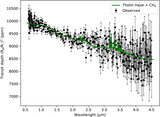
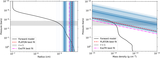
Best-fit spot contrasts from the individual channels (black) fit with spotrod, and binned to R = 10 for clarity (blue). Best-fit spot contrasts derived with starry on R = 10 binned spectroscopic light curves are plotted in green. Regardless of model or method (fit then bin vs. bin then fit), the spot contrasts from both are statistically the same. Assuming a photosphere temperature of 5700 K, we include a range of PHOENIX-derived spot temperature models for comparison and ignore wavelengths >4.5 μm, which demonstrate significant scatter in the individual channels. From this analysis, the measured spot contrasts suggest a spot temperature ΔT 200–300 K cooler than the photosphere.
Other Images in This Article
Show More
Copyright and Terms & Conditions
© 2026. The Author(s). Published by the American Astronomical Society.