Image Details
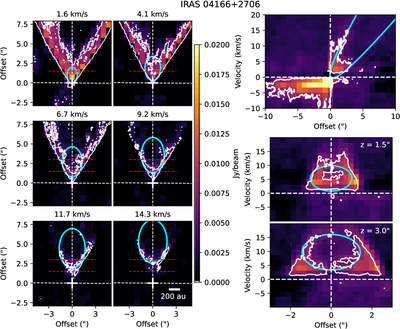
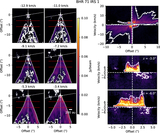
Caption: Figure 6.
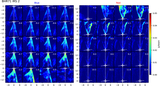
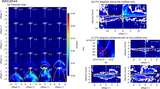
Similar to Figure 1 but for IRAS 04166. This is an example of an outflow showing a combination of slow disk wind and wind-driven shell emission. The bottom-right panel shows the P–V diagrams perpendicular to the outflow axis at 1﹩\mathop{.}\limits^{\unicode{x02033}}﹩5 (middle right) and 3″ (bottom right) from the protostar.
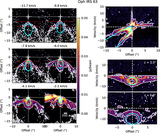
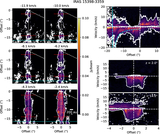
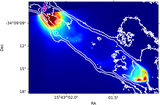
Other Images in This Article
Copyright and Terms & Conditions
© 2026. The Author(s). Published by the American Astronomical Society.
Copyright ©
2026 Astronomy Image Explorer. All Rights Reserved.