Image Details
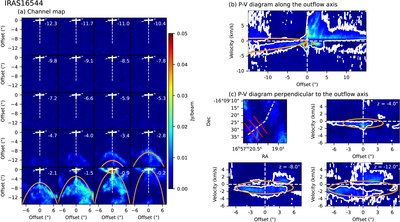
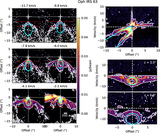
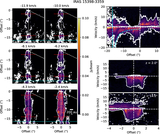
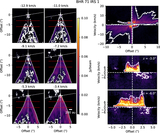
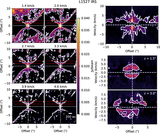
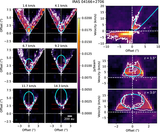
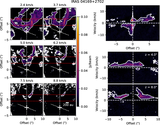
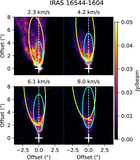
Caption: Figure 11. Channel maps and the P–V diagrams
The complete figure set (11 images) is available in the online journal.
(a) The velocity channel map, (b) the P–V diagram along the outflow axis, and (c) the P–V diagrams perpendicular to the outflow axis of the blueshifted outflow of IRAS 16544-1604. The positions of the P–V cuts are indicated in the channel map in the top right of (c). The distance in arcseconds of the P–V cut from the source along the jet axis is indicated in the top right of each P–V diagram. The white contours in the P–V diagrams depict 4σ and 5σ. The feature categorized as a wind-driven shell is fitted with a simple model described by Equation (1), which is indicated by the orange lines.
Other Images in This Article
Copyright and Terms & Conditions
© 2026. The Author(s). Published by the American Astronomical Society.