Image Details
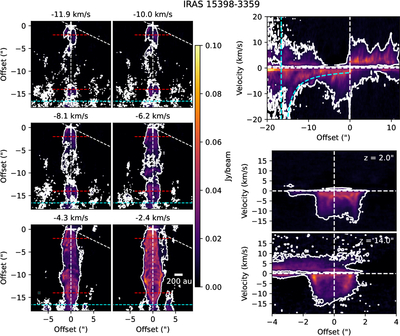
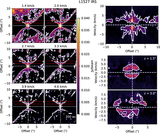
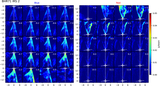
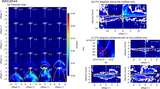
Caption: Figure 2.
Similar to Figure 1 but for IRAS 15398, the only source in our sample to clearly show jet-driven bow shock emission. The bottom-right panel shows the P–V diagrams perpendicular to the outflow axis at 2″ (middle right) and 14″ (bottom right) from the protostar. The position of the bow shock is indicated by the dotted cyan line at offset = 16﹩\mathop{.}\limits^{\unicode{x02033}}﹩6, while the cyan dotted curve in the P–V diagram along the outflow axis (upper-right panel) shows a schematic emission shape as expected from the bow shock model.
Other Images in This Article
Copyright and Terms & Conditions
© 2026. The Author(s). Published by the American Astronomical Society.
Copyright ©
2026 Astronomy Image Explorer. All Rights Reserved.