Image Details
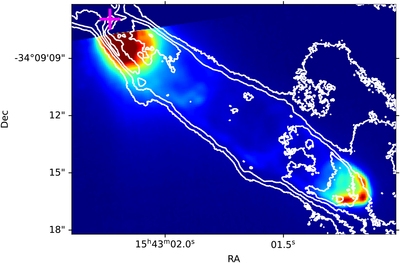
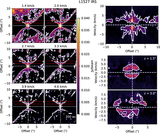
Caption: Figure 3.
Integrated intensity map of 12CO of IRAS 15398 (contours) overlaid on a JWST MIRI image taken with the F1000W filter (color scale). The contours shown are 3σrms, 10σrms, 20σrms, 30σrms, and 40σrms, where σrms = 150 mJy beam−1 km s−1 is the rms noise of the image. The position of IRAS 15398 is indicated by the magenta cross. The south lobe is the same lobe shown in the channel map in Figure 2.
Other Images in This Article
Copyright and Terms & Conditions
© 2026. The Author(s). Published by the American Astronomical Society.
Copyright ©
2026 Astronomy Image Explorer. All Rights Reserved.