Image Details
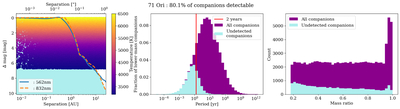
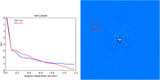
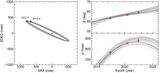
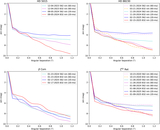
Caption: Figure 8. Missing companion analysis for the 80 targets in this study.
The complete figure set (80 images) is available in the online journal.
Results of the Missing Companions Analysis for 71 Ori. Left: simulated stellar companions as a function of magnitude difference and separation. The color of the points indicates the effective temperatures of the simulated companions. The solid and dashed red lines show the contrast curves from our speckle observations. Above these lines, we would expect to detect the companion. The region of Δm versus separation space that is shaded cyan represents the area where companions could reside and would not be detected by our speckle observations. The plot extends out to 1﹩\mathop{.}\limits^{\unicode{x02033}}﹩17 as beyond this, the correlation between the speckles breaks down, and we lose detection sensitivity. For 71 Ori, this corresponds to a separation of 25.48 au. Middle: Period distributions of the simulated companions. The magenta histogram is the distribution of all 100,000 simulated companions, while the light blue histogram highlights what would not be detectable in our speckle observations. Right: similar to the middle panel, but for mass ratio. We find that 80.1% of the simulated companions to this target are detected.
Other Images in This Article
Copyright and Terms & Conditions
© 2026. The Author(s). Published by the American Astronomical Society.