Image Details
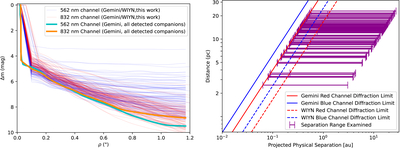
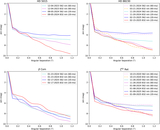
Caption: Figure 3.
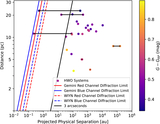
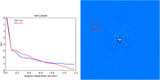
Left: contrast curves for the 80 HWO targets surveyed in this work. The 562 nm and 832 nm contrast curves are shown as blue and red lines, respectively. The solid cyan and orange lines represent a fit to the envelope of binaries detected by ‘Alopeke and Zorro and listed on ExoFOP. These contrast curves show that we detect stellar companions that are fainter than their primaries by 4–5 mag at the diffraction limits of the telescopes. Right: the projected physical separation range surveyed by our speckle observations for each target, shown as magenta bars. Solid and dashed lines represent the diffraction limits for the 562 nm (blue) and 832 nm (red) filters at Gemini (‘Alopeke and Zorro) and WIYN (NESSI). This figure shows that speckle imaging surveys a necessary parameter space in the search for potential companions.
Other Images in This Article
Copyright and Terms & Conditions
© 2026. The Author(s). Published by the American Astronomical Society.