Image Details
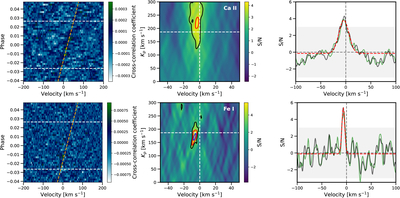
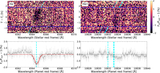
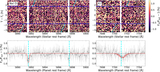
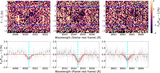
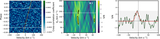
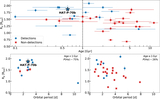
Caption: Figure 7.
Cross-correlation results of HAT-P-70b with robust detections that have S/N ≥ 4 (top: Ca II, bottom: Fe I). Left panel: cross-correlation residual map. The horizontal white dashed lines mark the first and fourth contacts of the transit event. The orange tilted dashed line represents the planet's trajectory. Middle panel: The cross-correlation S/N as a function of the velocity shift (Δv) and planet Keplerian velocity (Kp). The vertical and horizontal white dashed lines show the expected location of the planet signal (0 km s−1 and 187 km s−1). The black, red, and blue contour lines mark the region with S/N equal to 3, 4, and 5. Right panel: The 1D cross-correlation function at the best Kp (black) along with the best-fit Gaussian profile (red). The green line is the same result, but based on the Kp in the literature (see Section 3.3.3 for details). The gray shaded region highlights the cross-correlation S/N between −3 and 3.
Other Images in This Article
Show More
Copyright and Terms & Conditions
© 2026. The Author(s). Published by the American Astronomical Society.