Image Details
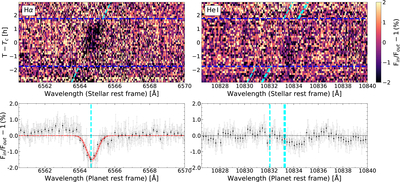
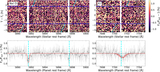
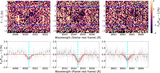
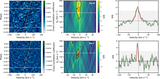
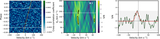
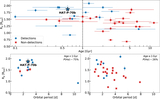
Caption: Figure 4.
Residual maps and transmission spectra around Hα (left) and the He I NIR triplet (right) lines. Top panels: residual maps in the stellar rest frame. The time since midtransit time (Tc) is shown on the vertical axis, wavelength is on the horizontal axis, and relative absorption is color coded. Dashed blue horizontal lines indicate the transit duration. Dashed cyan tilted lines show the theoretical trace of the planetary signals. Bottom panels: transmission spectra obtained by combining all the spectra between the first and fourth contacts. We show the original data in light gray and the data binned by 0.2 Å in black. The best-Gaussian-fit model is shown in red along with its 1σ uncertainties (shaded red region). Dashed cyan vertical lines indicate the Hα (left) and the He I triplet (right) lines' positions. All wavelengths in this figure are given in vacuum.
Other Images in This Article
Show More
Copyright and Terms & Conditions
© 2026. The Author(s). Published by the American Astronomical Society.