Image Details
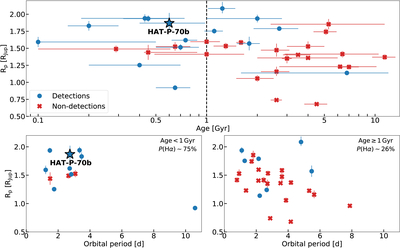
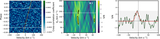
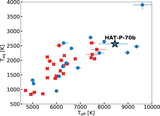
Caption: Figure 9.
Distribution of Hα observations for gas giants as a function of the stellar age vs. planetary radius (top panel), and period vs. radius diagram for <1 Gyr old (bottom left panel) and ≥1 Gyr old (bottom right panel) planets. HAT-P-70b is labeled and marked with a blue star in the panels. Planets with detection of Hα are marked with blue dots, while those with Hα nondetections/upper limits are marked with red crosses. We indicate the 1 Gyr value with a dashed black horizontal line in the top panel. Results are retrieved from the ExoAtmospheres website.
Other Images in This Article
Show More
Copyright and Terms & Conditions
© 2026. The Author(s). Published by the American Astronomical Society.
Copyright ©
2026 Astronomy Image Explorer. All Rights Reserved.