Image Details
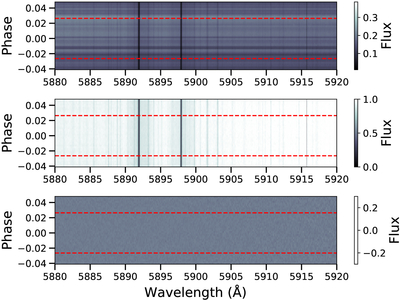
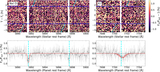
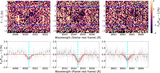
Caption: Figure 3.
Top panel: raw spectrum matrix around the Na I doublet. Middle panel: normalized spectrum matrix after preprocessing (see Section 3.3.1 for details). Bottom panel: spectrum matrix after five SYSREM iterations. In all panels, the horizontal red dashed lines represent the first and fourth contacts of the transit event.
Other Images in This Article
Show More
Copyright and Terms & Conditions
© 2026. The Author(s). Published by the American Astronomical Society.
Copyright ©
2026 Astronomy Image Explorer. All Rights Reserved.