Image Details
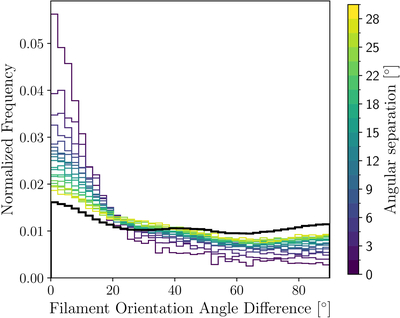
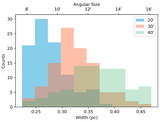
Caption: Figure 4.
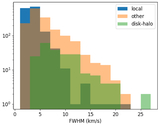
A density histogram showing the difference in angle on the sky for filaments with different spatial separations (color bar). The black histogram shows the orientation angle difference over the full filament population. This plot shows that at smaller separations, filaments are more likely to be parallel to each other.
Other Images in This Article
Copyright and Terms & Conditions
© 2026. The Author(s). Published by the American Astronomical Society.
Copyright ©
2026 Astronomy Image Explorer. All Rights Reserved.