Image Details
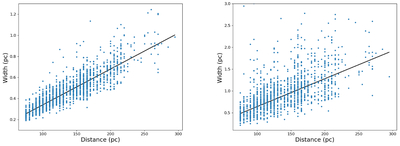
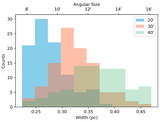
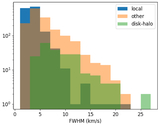
Caption: Figure 7.
The lower limits on the distances to the local filaments versus the distribution of distance-corrected filament widths. These are from the FilFinder method applied to the USM data (left) and raw data (right). The solid line shows what the median width at a fixed distance (0.34 pc and 0.64 pc at 100 pc) would scale to at a given distance.
Other Images in This Article
Copyright and Terms & Conditions
© 2026. The Author(s). Published by the American Astronomical Society.
Copyright ©
2026 Astronomy Image Explorer. All Rights Reserved.