Image Details
Caption: Figure 1.
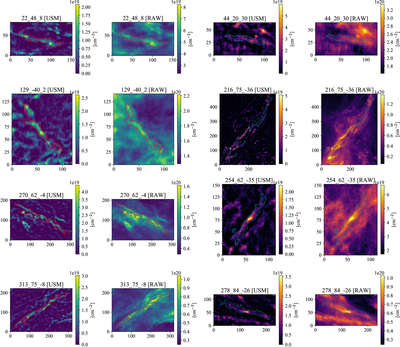
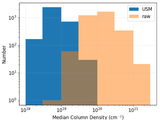
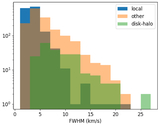
Moment 0 maps of example 3D H I filaments from the local (left two columns) and disk–halo (right two columns) populations. The red and green contour lines are the filament masks as identified by fil3d and the background is the USM GALFA-HI data (labeled “USM”) for the first column of each population and the original raw data for the second column (labeled “RAW”), integrated over the FWHM velocity width. The axes are in pixels which are 1﹩{}^{{\prime} }﹩. It is evident that the USM successfully extracts the filaments, but also removes a diffuse component that affects the derived column densities and widths.
Other Images in This Article
Copyright and Terms & Conditions
© 2026. The Author(s). Published by the American Astronomical Society.