Image Details
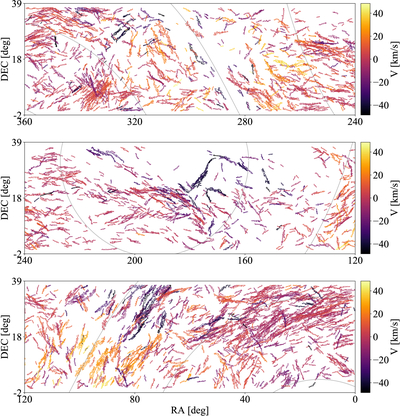
Caption: Figure 2.
The distribution of the 3D filament catalog on the GALFA-HI survey area with the color showing the average velocity of each filament in the local standard of rest (LSR) frame. The coordinates are noted in R.A. (x-axis) and decl. (y-axis) in degrees and the gray lines on the background represent different Galactic latitudes in 30° increments (top: −30°, 0°, and 30° (inner Galaxy); middle: 60° and 30°; bottom: 0°, −30°, and −60° (outer Galaxy)).
Other Images in This Article
Copyright and Terms & Conditions
© 2026. The Author(s). Published by the American Astronomical Society.
Copyright ©
2026 Astronomy Image Explorer. All Rights Reserved.