Image Details
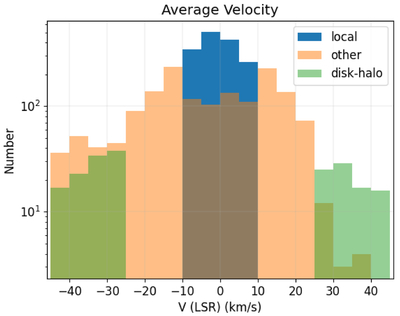
Caption: Figure 3.
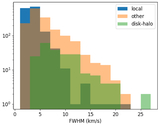
Histogram of the average velocities of the local, disk–halo, and other 3D filaments with the y-axis the number of filaments on a log scale. The “other” population may have local or disk–halo filaments within it, but their locations are less certain.
Other Images in This Article
Copyright and Terms & Conditions
© 2026. The Author(s). Published by the American Astronomical Society.
Copyright ©
2026 Astronomy Image Explorer. All Rights Reserved.