Image Details
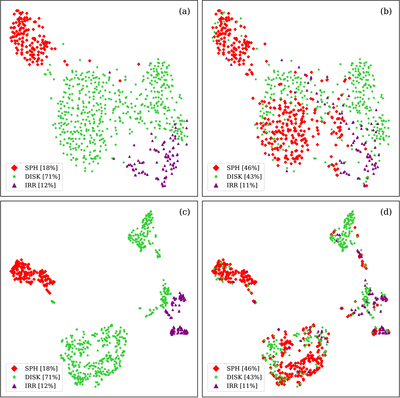
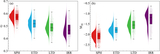
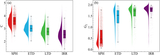
Caption: Figure 7.
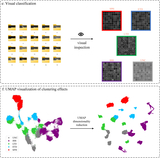
Two-dimensional visualization of morphological classification results for the matched subsample. Panel (a) depicts the t-SNE projection of the proposed UML method on ConvNeXt features (2048-dimensional), while Panel (b) presents the corresponding results from the Galaxy Zoo: Hubble catalog (K. W. Willett et al. 2017) on the same features. Panels (c) and (d) display t-SNE projections of the two methods on 300-dimensional features, respectively. Comparative analysis demonstrates that for the proposed UML method, Panels (a) and (c) exhibit more compact intra-class clustering and more distinct interclass separation.
Other Images in This Article
Show More
Copyright and Terms & Conditions
© 2026. The Author(s). Published by the American Astronomical Society.