Image Details
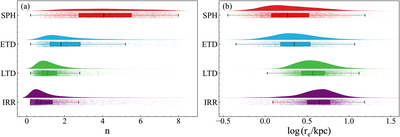
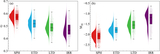
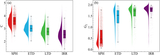
Caption: Figure 8.
Raincloud plots of the Sérsic index (left panel) versus effective radius (right panel) for different massive galaxy types. The “cloud” portion of the plot reflects the data density distribution characteristics, and the “rain” plot portion demonstrates the degree of dispersion of the sample values. In the box plot, the lower boundary corresponds to the first quartile, the upper boundary corresponds to the third quartile, the horizontal line in the center indicates the median, and the upper and lower whisker ends of the box represent the maximum and minimum values. It can be seen that the Sérsic index gradually decreases as the galaxy type goes from SPHs to IRRs, while the effective radius gradually increases.
Other Images in This Article
Show More
Copyright and Terms & Conditions
© 2026. The Author(s). Published by the American Astronomical Society.