Image Details
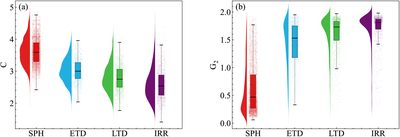
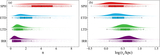
Caption: Figure 10.
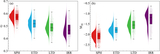
Raincloud plots of C (left panel) and G2 (right panel) for different types of massive galaxies. Analogues are similar to Figure 8. It can be seen that from SPHs to IRRs, the C of galaxies gradually decreases, while the effective G2 gradually increases.
Other Images in This Article

Show More
Copyright and Terms & Conditions
© 2026. The Author(s). Published by the American Astronomical Society.
Copyright ©
2026 Astronomy Image Explorer. All Rights Reserved.