Image Details

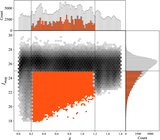
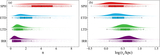
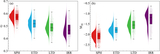
Caption: Figure 12.
Panel (a) displays the distributions of the Sérsic index for ETGs and LTGs. The gray dashed line marks the classification threshold at n = 2.5. Panel (b) shows the distribution in the G–M20 plane for galaxies classified as ETGs and LTGs. The contour levels enclose 20%, 50%, and 80% of the respective subclass, from the innermost to the outermost regions. The dashed line, given by G = 0.14M20 + 0.80 (J. M. Lotz et al. 2008), represents the boundary between LTGs and ETGs.
Other Images in This Article
Show More
Copyright and Terms & Conditions
© 2026. The Author(s). Published by the American Astronomical Society.
Copyright ©
2026 Astronomy Image Explorer. All Rights Reserved.