Image Details
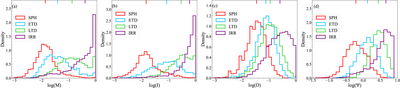
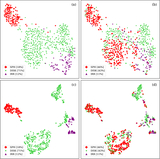
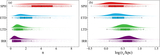
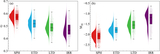
Caption: Figure 11.
Distributions of multimode (M, panel (a)), intensity (I, panel (b)), deviation (D, panel (c)), and multiplicity (Ψ, panel (d)) for different types of massive galaxies. The top bars represent the median values of M, I, D, and Ψ for different types of galaxies. The median values of the galaxies are gradually increasing from SPHs to IRRs.
Other Images in This Article
Show More
Copyright and Terms & Conditions
© 2026. The Author(s). Published by the American Astronomical Society.
Copyright ©
2026 Astronomy Image Explorer. All Rights Reserved.