Image Details
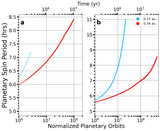
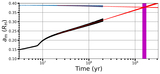
Caption: Figure 9.
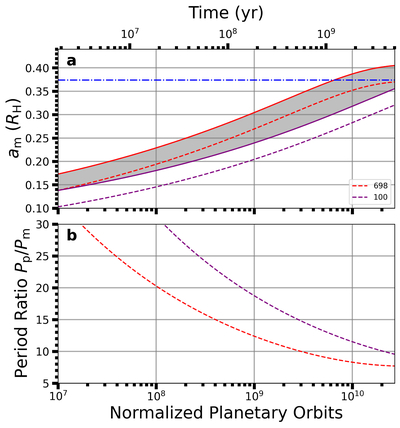
Secular evolution of one HZ planet–moon system orbiting an M0 dwarf. Time evolution of the (a) exomoon’s semimajor axis am and (b) planet to moon period ratio Pp/Pm for one case in the M0 parameter space (0.52 au, 2.0 M⊕) using secular tidal theory. The bottom x-axis, plotted on a logarithmic scale, shows time normalized by the orbital period of a planet at the inner edge of the HZ (0.27 au) while the top x-axis shows time (in years). The red and purple dashed lines represent a τp of 698 and 100 s, respectively, while the red and purple solid lines represent those curves with the added bump of 0.035 RH, accounting for expected MMR and three-body effects. The gray-shaded region represents the area of expected curves between the boosted 698 s upper limit and boosted 100 s lower limit while the blue dashed–dotted line represents the moon’s stability limit.
Other Images in This Article
Copyright and Terms & Conditions
© 2025. The Author(s). Published by the American Astronomical Society.