Image Details
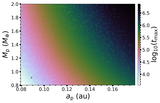
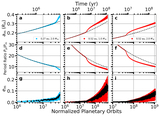
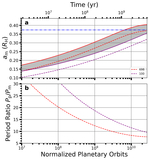
Caption: Figure 3.
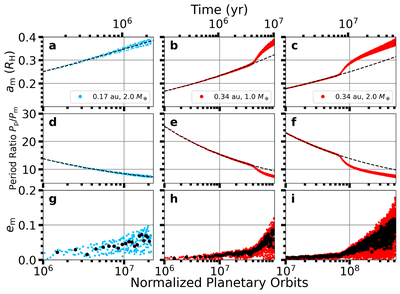
Time evolution for three HZ planet–moon systems orbiting an M2 dwarf. Time evolution of the (a–c) exomoon’s semimajor axis am, (d–f) planet to moon period ratio Pp/Pm, and (g-i) exomoon’s eccentricity em for 3 distinctive points in the parameter space (0.17 au and 2.0 M⊕, 0.34 au and 1.0 M⊕, 0.34 au and 2.0 M⊕) in the M2 case. The bottom x-axis, plotted on a logarithmic scale, shows time normalized by the orbital period of a planet at the inner edge of the HZ (0.17 au) while the top x-axis shows time (in years). The blue and red points signify rebound results while black dashed lines represent results from secular tidal theory. Black dots in the eccentricity panels represent the median value over 1 million orbits.
Other Images in This Article
Copyright and Terms & Conditions
© 2025. The Author(s). Published by the American Astronomical Society.