Image Details
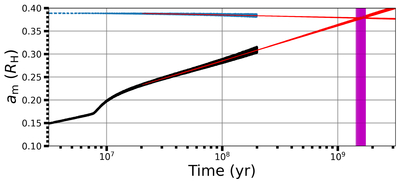
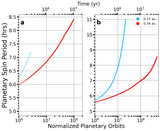
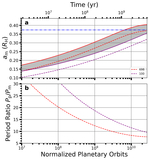
Caption: Figure 8.
Best-fit analysis for the lifetime of one HZ planet–moon system orbiting an M0 dwarf. Time evolution of the exomoon’s semimajor axis for a representative case within the M0 parameter space (0.52 au, 2.0 M⊕), computed using rebound. Black points denote the rebound simulation results, while the blue dashed line indicates the moon’s stability limit. Red curves correspond to best-fit lines for both the stability threshold and the rebound evolution. Their intersection, marking the estimated instability time, is highlighted in magenta.
Other Images in This Article
Copyright and Terms & Conditions
© 2025. The Author(s). Published by the American Astronomical Society.
Copyright ©
2025 Astronomy Image Explorer. All Rights Reserved.