Image Details
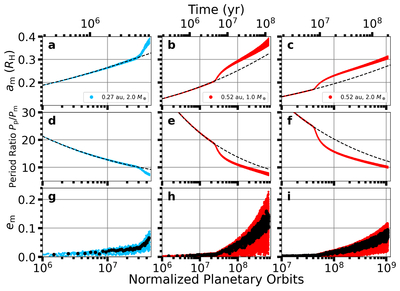
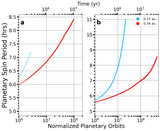
Caption: Figure 7.
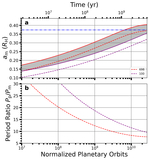
Time series plot for three HZ planet–moon systems orbiting an M0 dwarf. Same as Figure 3 but for moons in an M0 system. The three distinct points used are (0.27 au and 2.0 M⊕, 0.52 au and 1.0 M⊕, 0.52 au and 2.0 M⊕). The bottom x-axis uses 0.27 au as the inner edge of the HZ for normalization.
Other Images in This Article
Copyright and Terms & Conditions
© 2025. The Author(s). Published by the American Astronomical Society.
Copyright ©
2025 Astronomy Image Explorer. All Rights Reserved.