Image Details
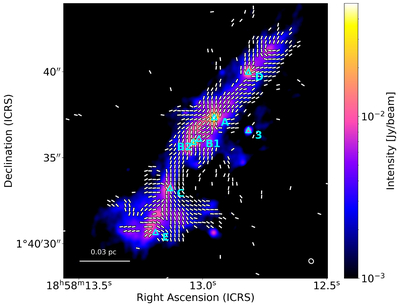
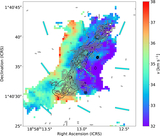
Caption: Figure 1.
Map of the magnetic field orientation obtained from dust polarization observations using ALMA in G35. The background image is the intensity (Stokes I) at Band 6 frequency, ∼250 GHz. The white segments show the magnetic field orientation, which is the polarization angle rotated by 90°, and is plotted roughly per independent beam. The triangles are the positions of cores found in previous ALMA dust continuum observations with a higher angular resolution than ours (Y. Zhang et al. 2022). The core names are labeled based on previous studies (Y. Zhang et al. 2022; Á. Sánchez-Monge et al. 2013). The physical scale and beam size are shown in the bottom left and right corners, respectively.
Other Images in This Article

Copyright and Terms & Conditions
© 2025. The Author(s). Published by the American Astronomical Society.