Image Details
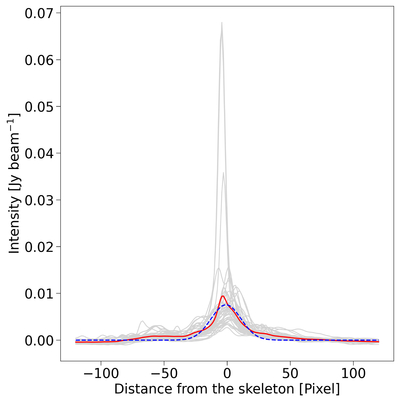
Caption: Figure 10.
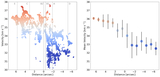
Intensity of dust continuum emission across the filaments. The horizontal axis shows the distance from the skeleton shown in the left panel of Figure 2. The gray lines show the intensity profiles perpendicular to each pixel on the skeleton with a spacing of a beam size. The red line shows the average value of the gray lines. The blue dashed line is obtained by fitting the red line with a single Gaussian.
Other Images in This Article

Copyright and Terms & Conditions
© 2025. The Author(s). Published by the American Astronomical Society.
Copyright ©
2025 Astronomy Image Explorer. All Rights Reserved.