Image Details
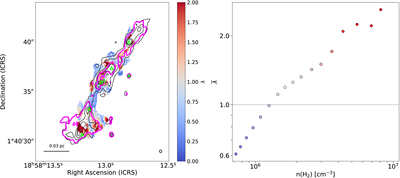
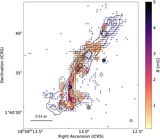
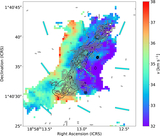
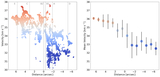
Caption: Figure 5.
(Left) The map of the mass-to-flux ratio in G35. Black contours are the same as shown in Figure 3. The green triangles are the same as shown in Figure 1. (Right) Mean mass-to-flux ratio, ﹩\overline{\lambda }﹩, as a function of number density cut. The mean mass-to-flux ratio is calculated using the mean column density and magnetic field strength within the number density cut. When ﹩\overline{\lambda }﹩ is 1, the number density is 1.2 × 106 cm−3, which is shown as the magenta contour in the left panel.
Other Images in This Article

Copyright and Terms & Conditions
© 2025. The Author(s). Published by the American Astronomical Society.
Copyright ©
2025 Astronomy Image Explorer. All Rights Reserved.