Image Details
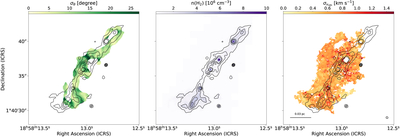
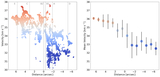
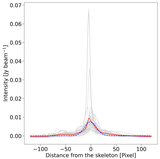
Caption: Figure 3.
The maps of polarization angle dispersion (left), volume density (middle), and nonthermal velocity dispersion of the nonthermal component of H13CO+ (right) in G35. Black contours show the flux density of G35 at 10, 20, 30, and 40 ×δI levels. The region within 10 ×δI level is comparable to the filament with the width of 0.015 estimated in Section 3.3 along the black skeleton shown in Figure 2.
Other Images in This Article

Copyright and Terms & Conditions
© 2025. The Author(s). Published by the American Astronomical Society.
Copyright ©
2025 Astronomy Image Explorer. All Rights Reserved.