Image Details

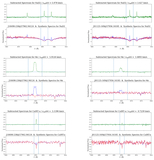
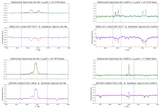
Caption: Figure 8.
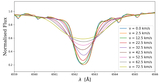
First row: calibration for the Ca II H and K doublet (left panel), He I D3 and also Na I D1, D2 (middle panel), and Ca II IRT lines (right panel). Second row: the curves for Paδ (left panel), Paγ + He I λ10830 (middle panel) and Paβ (right panel). All are in the range of effective temperatures [2200, 7000] K. The calibration curve for Hα can be seen in Figure 4.
Other Images in This Article

Copyright and Terms & Conditions
© 2025. The Author(s). Published by the American Astronomical Society.
Copyright ©
2026 Astronomy Image Explorer. All Rights Reserved.