Image Details
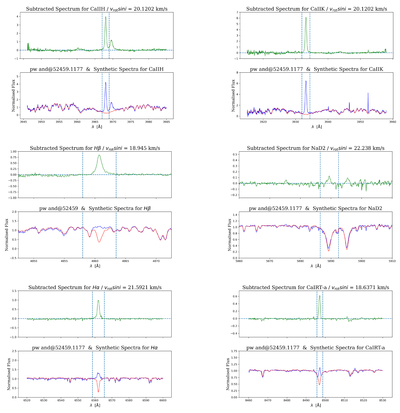
Caption: Figure 5.
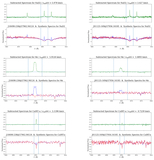
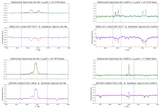
Spectral subtraction example from PW And, a K2V star. The different spectra show chromospheric indicators in Ca II H and K (top panels), Hβ and Na I D2 (middle panels), and Hα and Ca II IRT-a lines (bottom panels). Using FOCES provided spectra for each panel. Lower panel: observed target spectrum (blue) and synthetic spectrum (red), obtained from a reference star spectrum; upper panel: subtracted spectrum (green). In both panels, the vertical blue dashed lines mark the integration limits for the chromospheric excess emission EW determination.
Other Images in This Article
Copyright and Terms & Conditions
© 2025. The Author(s). Published by the American Astronomical Society.
Copyright ©
2026 Astronomy Image Explorer. All Rights Reserved.