Image Details
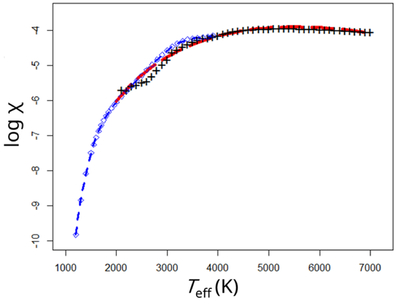
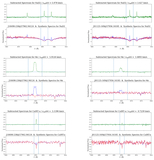
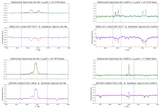
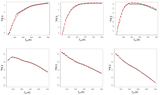
Caption: Figure 4.
Comparison between the polynomial fit provided in A. Reiners & G. Basri (2008; blue) in the range [1200, 4000] and in the calculations of this paper (red), in the range [2000, 7000]. The points obtained from the set of synthetic spectra are shown by the black plus signs.
Other Images in This Article

Copyright and Terms & Conditions
© 2025. The Author(s). Published by the American Astronomical Society.
Copyright ©
2026 Astronomy Image Explorer. All Rights Reserved.