Image Details
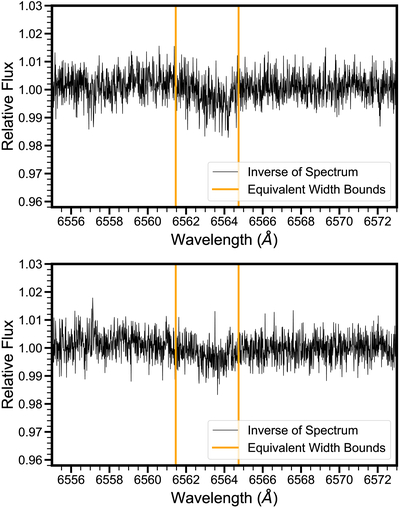
Caption: Figure 13.
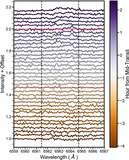
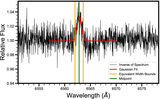
Same as Figure 7 but for DS Tuc A b for the two different transits observed. Top is 2019 August 19 and bottom is 2019 October 7 UT. The orange lines indicate the bounds of integration for the equivalent width calculation (Figure 12). A feature is present, but it shows excess emission (weaker absorption)—an exosphere would manifest as excess absorption.
Other Images in This Article


Show More
Copyright and Terms & Conditions
© 2025. The Author(s). Published by the American Astronomical Society.
Copyright ©
2025 Astronomy Image Explorer. All Rights Reserved.