Image Details
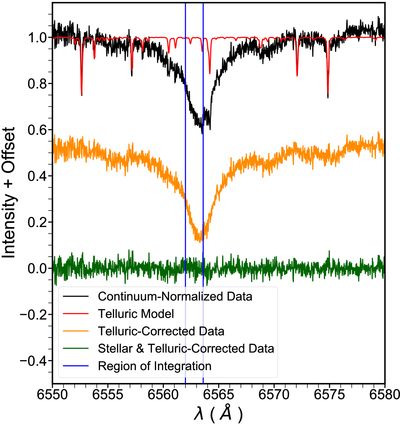
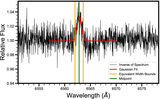
Caption: Figure 2.
A schematic depicting the data reduction process using a sample spectrum from observations of HIP 67522 b. We represent the continuum-normalized raw data in black, the telluric model in red, the telluric-corrected data in orange, and the continuum-normalized telluric and stellar-corrected data in green. All steps in the reduction process depicted are offset by a scalar for better visualization. The region of integration used for HIP 67522 b is noted by the vertical blue lines.
Other Images in This Article


Show More
Copyright and Terms & Conditions
© 2025. The Author(s). Published by the American Astronomical Society.
Copyright ©
2025 Astronomy Image Explorer. All Rights Reserved.