Image Details
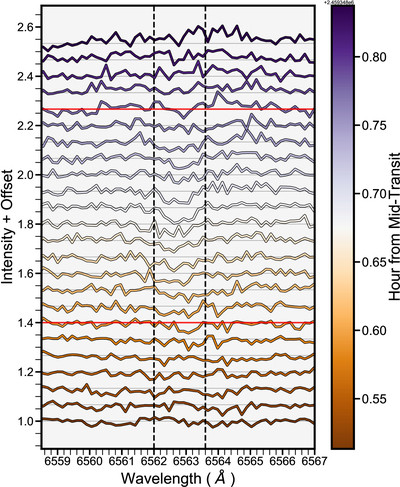
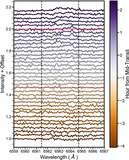
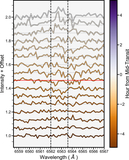
Caption: Figure 3.
The time evolution of the reduced and template-corrected spectra for HIP 67522 b spanning observations on 2021 May 14 UT. The color bar shows the time of observation relative to the predicted midpoint of the transit. The lines in red denote ingress and egress. The vertical dashed lines mark the region used to calculate the equivalent widths.
Other Images in This Article


Show More
Copyright and Terms & Conditions
© 2025. The Author(s). Published by the American Astronomical Society.
Copyright ©
2025 Astronomy Image Explorer. All Rights Reserved.