Image Details
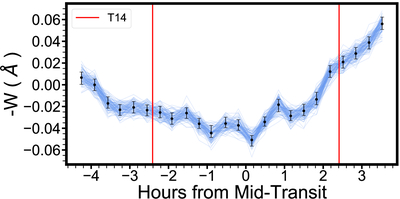
Caption: Figure 9.
Equivalent widths of Hα for HIP 67522 b spanning observations on 2021 May 14 UT. Each of the 100 overlapping blue lines represents a single set of realizations from our Monte-Carlo error perturbation. The black dots are the average equivalent width for each time step, with error bars marking a 1σ range of uncertainties. The vertical red lines denote the start and end times of the predicted transit (T14).
Other Images in This Article


Show More
Copyright and Terms & Conditions
© 2025. The Author(s). Published by the American Astronomical Society.
Copyright ©
2025 Astronomy Image Explorer. All Rights Reserved.