Image Details
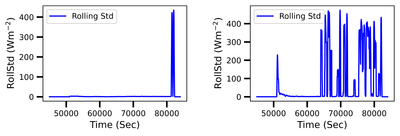
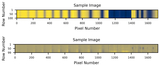
Caption: Figure 3.
(Left) The rolling standard deviation of the irradiance profile for a clear-sky day, showing consistently low values with a spike at dusk due to the sharp decline in irradiance. (Right) The rolling standard deviation of the irradiance profile for a cloudy day, where higher values indicate significant fluctuations in solar irradiance.
Other Images in This Article
Show More
Copyright and Terms & Conditions
© 2025. The Author(s). Published by the American Astronomical Society.
Copyright ©
2025 Astronomy Image Explorer. All Rights Reserved.