Image Details
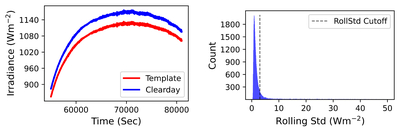
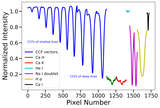
Caption: Figure 2.
(Left) The irradiance profile for a clear day compared with its monthly template from November, showing similar characteristics. (Right) A histogram of the rolling standard deviation for 30,000 randomly selected FITS file windows, displaying a pseudo-Gaussian distribution with a pronounced long tail. The chosen clear-sky day cutoff at 3 W m−2 is marked by the vertical dashed line.
Other Images in This Article
Show More
Copyright and Terms & Conditions
© 2025. The Author(s). Published by the American Astronomical Society.
Copyright ©
2025 Astronomy Image Explorer. All Rights Reserved.