Image Details
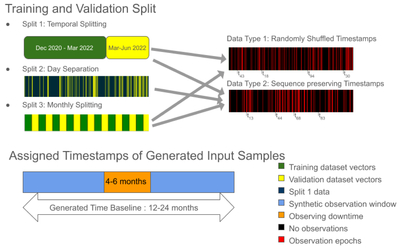
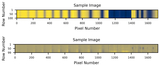
Caption: Figure 7.
This figure illustrates how observational data are partitioned into training and validation sets and how individual samples are formatted for model input. (Top) The left side illustrates how the data set is partitioned across multiple validation strategies. In Split 1, validation subsets V1 and V2 are selected using a time-contiguous strategy. Split 2 is applied concurrently, where the validation subset V3 is defined by day-separated observations. In this Split 2 view, the remainder of the data set, corresponding to the Split 1 training and validation regions, is dimmed (dark blue) to highlight the distinct structure of V3. A monthly based split is also used, enabling training over longer timescales while preserving a distinct validation set M (see Section 4.2). The right side depicts the format of individual data samples. Each sample is a sequence of 100 epochs, where colored regions indicate epochs with observations and black regions mark epochs with no observation. Two formats are used; one that preserves the temporal order of observed epochs, and another where observations are randomly shuffled to remove sequential information. (Bottom) Observation uptime and downtime: observation baselines vary between 12 and 24 months, interspersed with typical downtime periods lasting 4–6 months due to mission scheduling or survey gaps.
Other Images in This Article
Show More
Copyright and Terms & Conditions
© 2025. The Author(s). Published by the American Astronomical Society.