Image Details
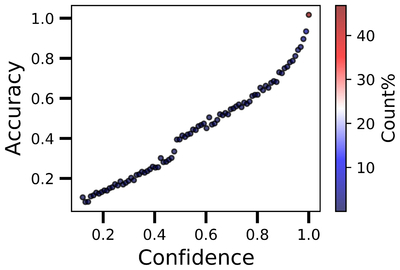
Caption: Figure 14.
This plot depicts the relationship between period prediction confidence and accuracy for the shuffled data set V1. The confidence values, ranging from 0 to 1, are divided into 100 bins, with the corresponding accuracy values depicted for each bin. As confidence in the machine learning model’s period predictions increases, accuracy improves. Low-confidence predictions exhibit minimal accuracy, while accuracy steadily increases and approaches 1 as confidence nears its maximum value. Notably, approximately 40% of the predictions fall into the highest confidence bin (confidence >0.99), where accuracy reaches nearly 99%. This distribution suggests a saturation effect, with a significant accumulation of predictions in the highest confidence range.
Other Images in This Article
Show More
Copyright and Terms & Conditions
© 2025. The Author(s). Published by the American Astronomical Society.