Image Details
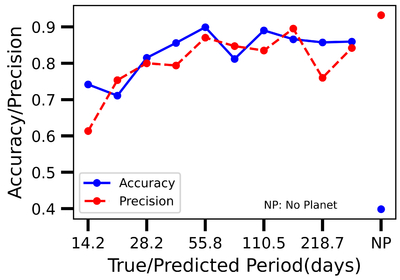
Caption: Figure 13.
This figure illustrates the model’s accuracy and precision for the shuffled data set V1, highlighting its performance across different period labels. Accuracy indicates the fraction of correctly predicted cases for each true period label, while precision represents the proportion of predictions for a given label that correspond to true positives. Both metrics generally show strong alignment across most period values, with two notable exceptions: the shortest period class and the “no planet” hypothesis (last label). In the “no planet” scenario, high precision demonstrates that the model’s no planet predictions are largely correct. However, low accuracy reveals frequent misclassification of true no planet cases as planetary detections. In contrast, the shortest period class exhibits a less pronounced but opposite effect, where accuracy surpasses precision, leading to a divergence between the two metrics in these specific scenarios.
Other Images in This Article
Show More
Copyright and Terms & Conditions
© 2025. The Author(s). Published by the American Astronomical Society.