Image Details
Caption: Figure 12.
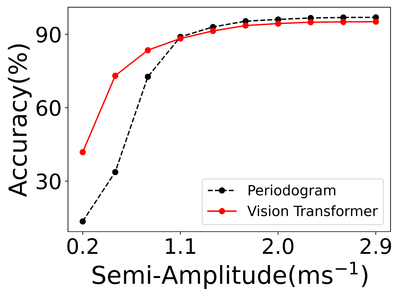
This figure shows a comparison of the Lomb–Scargle periodogram and machine learning model performance for the shuffled data set V1. The figure compares how accurately each method identifies the correct period bin, with the periodogram’s power spectrum maxima discretized to align with the bin structure of the machine learning model, enabling a direct comparison. The model achieves significantly higher accuracy at lower semi-amplitudes, while the periodogram slightly surpasses the model by approximately 3% at higher amplitudes. This comparison focuses on discretized outputs, excluding factors such as peak amplitude and false alarm probabilities inherent to the periodogram.
Other Images in This Article
Show More
Copyright and Terms & Conditions
© 2025. The Author(s). Published by the American Astronomical Society.