Image Details
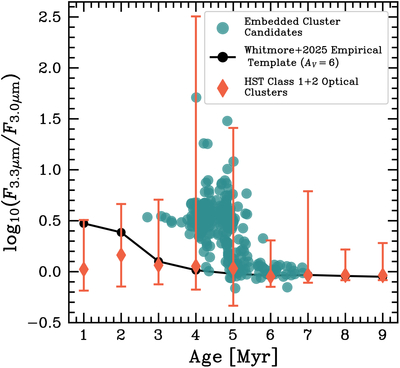
Caption: Figure 12.
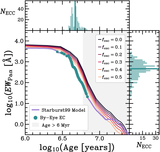
3.3 μm/3.0 μm flux ratio vs. stellar population age for our embedded cluster candidate sample (cyan circles) and the HST Class 1+2 optical clusters from D. Maschmann et al. (2024) for five galaxies in our sample (orange diamonds). The vertical orange lines denote the 10th to 90th percentile range for each age bin, and the diamond marks the 50th percentile for the Class 1+2 clusters. Optical cluster ages are from D. Thilker et al. (2024), and embedded cluster candidate ages are from Section 5.2.1 of this work. We compare these values to the empirical template from B. C. Whitmore et al. (2025), reddened for an AV = 6 (black track).
Other Images in This Article
Show More
Copyright and Terms & Conditions
© 2025. The Author(s). Published by the American Astronomical Society.