Image Details
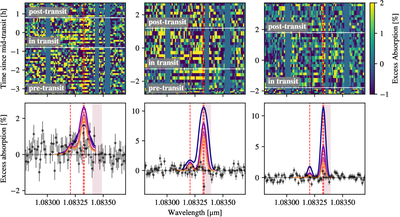
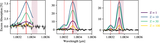
Caption: Figure 3.
Top row: Keck/NIRSPEC excess absorption in percent of TOI-4010 b (first panel), TOI-4010 c (second panel), and TOI-4010 d (third panel) in each planet’s rest frame as a function of time and wavelength (air wavelengths in planetary rest frame). Horizontal white lines mark the beginning (top) and end (bottom) of transit. Dashed vertical red lines denote the positions of the three helium lines. Red shaded regions mark the location of a telluric OH line that we masked in our analysis (see Figure 2). Bottom row: average excess absorption spectra for TOI-4010 b (first panel), TOI-4010 c (second panel), and TOI-4010 d (third panel) are shown as black points. The pyTPCI solar metallicity model predictions of the excess absorptions are shown as a blue line (nominal XUV flux), purple line (XUV flux reduced by a factor of five), pink line (XUV flux reduced by a factor of 10), and orange line (XUV flux reduced by a factor of 15).
Other Images in This Article

Copyright and Terms & Conditions
© 2025. The Author(s). Published by the American Astronomical Society.