Image Details
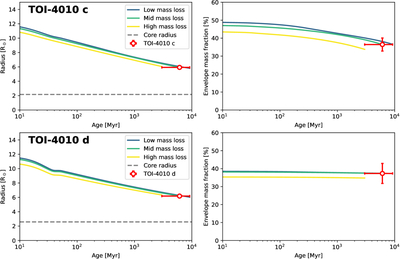
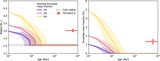
Caption: Figure 7.
Top panels: evolution of the radius (left panel) and envelope mass fraction (right panel) for TOI-4010 c, as described in Section 5.5. The solid lines show atmospheric evolution under different XUV irradiation histories and different values for the planet’s parameters within their 1σ uncertainty. The planet’s present-day location on each panel is plotted as a red circle. Bottom panels: evolution of the radius and envelope mass fraction for TOI-4010 d, following the top panels.
Other Images in This Article

Copyright and Terms & Conditions
© 2025. The Author(s). Published by the American Astronomical Society.
Copyright ©
2025 Astronomy Image Explorer. All Rights Reserved.